
Realtime weather reporting for aviation is a vital tool for pilot decision making and planning. Pilots have three primary types of real time or near real time weather reports available to them: ATIS, AWOS and ASOS.
Distinguishing between these sources is sometimes simple, and sometimes somewhat difficult. Each system provides much of the same information but differ in their level of automation, reliability, and detail provided to flight crews. What is the main difference between ATIS, AWOS, and ASOS?
ATIS contains current, routine information to arriving and departing aircraft as well as weather reports derived from human data collection that is updated hourly or upon pertinent data changes. AWOS and ASOS are automated and provide continuous real-time weather observations.
The Difference Between ATIS, AWOS, and ASOS
The ATIS (Automatic Terminal Information Service) weather product is often the easiest to identify and remember where it is found. ATIS reports are generated hourly (or as required) by human recording of weather conditions, meaning an operating control tower is required to receive this type of real time weather data. ATIS will be found at Class B, C and some Class D airports.
An ATIS report includes the airport, report identifier, time, runway in use, winds, visibility, cloud data, temperature and dewpoint, altimeter setting and then any additional pertinent information.
An AWOS (Automated Weather Observation System) station is a weather station that collects and broadcasts weather on a minute-by-minute basis.
These systems are largely automated but may include human observer monitoring when visibilities are reduced; if the AWOS is unmonitored, an “AUTO” tag is included in the textual output.
AWOS systems meet a variety of standards, however most systems include altimeter setting, winds, temperature and dewpoint, density altitude, visibilities, and ceilings.
But if they are both automated, what is the difference between AWOS and ASOS?
An ASOS (Automated Surface Observing System) station is functionally similar to AWOS (Automated Weather Observation System) stations but is managed, maintained and controlled by NOAA rather than the FAA or the organization that operates the airport.
ASOS stations may be found in locations other than airports if they serve to improve weather awareness in locations pertinent to general public.
These systems may or may not be monitored and include the “AUTO” tag in the textual output if no human observer is present.
Data Contained in ATIS, AWOS, vs. ASOS
Each of the aviation weather data sources (ATIS, AWOS, ASOS) largely report similar weather phenomena, however, there are specific outputs and limitations to these systems, depending on their configuration.
ATIS
ATIS systems are the least limited in what can be reported because ATIS data is generated by human intervention.
Often, the basic data is derived from an automated station located on the field but the human observer in the control tower can append additional data and commentary to the end of the report. ATIS reports will follow the following format:
Airfield, ATIS Identifier, Report Time, Runway(s) in use, Wind Speed and Direction, Visibility, Cloud Cover, Temperature, Dewpoint, Atmospheric Pressure, additional comments as required or appropriate.
The data prior to the comments is more or less standard for AWOS and ASOS systems as well and presented in much the same format.
The real benefit of an ATIS broadcast is in the comments.
NOTAMs, construction notices, runway and taxiway closures, transient conditions, birds, severe weather can all be much more reliably conveyed in the “comment section” of the ATIS broadcast.
AWOS
An AWOS system is fully automated when tagged with an “AUTO” but different AWOS systems contain different levels of weather sensing.
An AWOS system can report as little as an altimeter setting, or as much information as current precipitation and current runway conditions. The type of AWOS is noted in the Chart Supplements (the new name for the old Airport Facility Directory) under the weather data sources heading.
For example, the Newton, Kansas airport has an AWOS-3PT weather station.
The obvious question is what are the various AWOS service levels that are available and which systems provide what data types. Thankfully the AIM summarizes this data in section 7-1-10.
| Type | Wind | Visibility | Temperature / Dewpoint | Altimeter | Density Altitude | Clouds / Ceiling | Precip Type | Thunderstorms / Lightning | Precip Occurrence | Rain Accumulation | Runway Surface Condition | Freezing Precip | Remarks |
| AWOS-A | X | ||||||||||||
| AWOS – AV | X | X | |||||||||||
| AWOS – 1 | X | X | X | X | |||||||||
| AWOS – 2 | X | X | X | X | X | ||||||||
| AWOS – 3 | X | X | X | X | X | X | |||||||
| AWOS – 3P | X | X | X | X | X | X | X | ||||||
| AWOS – 3T | X | X | X | X | X | X | X | ||||||
| AWOS – 3PT | X | X | X | X | X | X | X | X | |||||
| AWOS – 4 | X | X | X | X | X | X | X | X | X | X | X | X |
Most AWOS systems pilots will encounter will be some variety of “-3”. Some of the data is only reported if pertinent.
Density altitude for example is only output if the density altitude is more than 1,000 feet above the airport elevation. Similarly, precipitation, thunderstorms, lightning and so on are only reported if the weather is present. Some of this data is included in the remarks section, depending on the AWOS configuration.
So, a typical AWOS broadcast will follow a similar pattern as the ATIS discussed previously.
Airport identifier, time, wind, visibility, clouds and ceiling, temperature, dewpoint, altimeter, remarks.
If human intervention was made in the report the broadcast will include “OBSERVER WEATHER” in the data, but human augmented AWOS stations are generally constrained to busier airports and occurs only when visibilities drop below 7 miles.
ASOS
An ASOS system can be thought of as an AWOS system but operated by the National Oceanic and Atmospheric Administration (NOAA).
An ASOS station shares its reporting data with the AWOS-3PT installations. The Chart Supplement publication will list for an airport if the station is an ASOS or AWOS, but an ASOS will report the following:
| Type | Wind | Visibility | Temperature / Dewpoint | Altimeter | Density Altitude | Clouds / Ceiling | Precip Type | Thunderstorms / Lightning | Precip Occurrence | Rain Accumulation | Runway Surface Condition | Freezing Precip | Remarks |
| ASOS | X | X | X | X | X | X | X | X | X | X |
As with the AWOS stations, unless there has been human intervention on the system, an “AUTO” indication will be included with the reported data.
Data Table for ATIS, AWOS, and ASOS
In summary, ATIS, AWOS and ASOS produce much of the same information, but vary in the number of parameters reported. The table below compares ATIS, AWOS and ASOS stations.
| Type | Wind | Visibility | Temperature / Dewpoint | Altimeter | Density Altitude | Clouds / Ceiling | Precip Type | Thunderstorms / Lightning | Precip Occurrence | Rain Accumulation | Runway Surface Condition | Freezing Precip | Remarks |
| ATIS | X | X | X | X | X | X | X | ||||||
| AWOS-A | X | ||||||||||||
| AWOS – AV | X | X | |||||||||||
| AWOS – 1 | X | X | X | X | |||||||||
| AWOS – 2 | X | X | X | X | X | ||||||||
| AWOS – 3 | X | X | X | X | X | X | |||||||
| AWOS – 3P | X | X | X | X | X | X | X | ||||||
| AWOS – 3T | X | X | X | X | X | X | X | ||||||
| AWOS – 3PT | X | X | X | X | X | X | X | X | |||||
| AWOS – 4 | X | X | X | X | X | X | X | X | X | X | X | X | |
| ASOS | X | X | X | X | X | X | X | X | X | X |
Remember that for an ATIS report, the tower controllers may add substantial additional comments, making those reports, beyond the basic weather data, highly non-standardized.
Automated Observations vs. Human Intervention
How can you identify an automated weather broadcast from one with human intervention, and when are automated systems monitored?
The difficulty lies solely with AWOS and ASOS stations.
ATIS reports are always human generated thanks to their association with towered airports. AWOS and ASOS stations will be automated unless otherwise marked.
For textual reports found in various online briefing sources, the “AUTO” prefix will append the weather report and the audio recording will lead with “AUTOMATED WEATHER OBSERVATION.” If either of these reports is missing, it means human intervention is present.
The reason for human intervention can be difficult to determine, but as noted above, for certain stations, human intervention or additional comments may be included during periods of particularly low weather or unusual conditions.
When visibilities drop below 7 miles, at stations associated with busier airports, look for the “OBSERVER WEATHER” note to be included with the weather broadcast. Weather stations that include human intervention are identified in the Chart Supplement publication.
Identifying an automated station is particularly important where a particular station is reporting wildly different weather than other stations nearby.
An “AUTO” report indicating 200-foot ceilings near other stations reporting clear skies indicates the sensor on that station may have malfunctioned. This is useful as a “sanity check” on weather reports during flight planning.
However, be advised that the FAA has taken the stance that an erroneous reading or a reading that is only effective on a portion of the runway (such as a fog bank) does constitute the legal weather report for establishing VFR and IFR operational requirements.
| Type | Automated? | Human Reported? | Human Intervention |
| ATIS | X | ||
| AWOS | X – “AUTO” | X – when visibility is less than 7 miles at certain facilities | |
| ASOS | X – “AUTO” | X – when visibility is less than 7 miles at certain facilities |
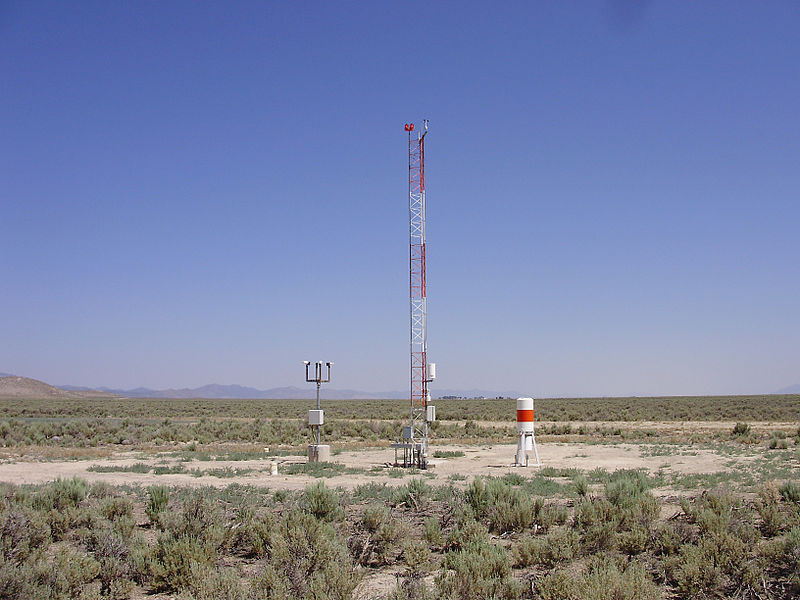
How Is Weather Report Data Collected?
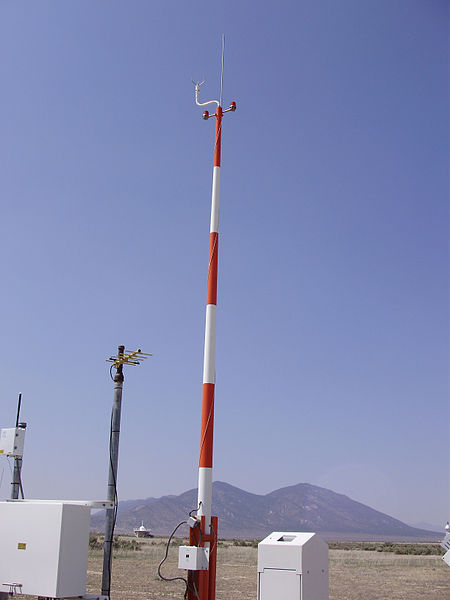
Wind
Wind is measured with two common sensor types; the traditional anemometer and wind vane used in older installations, or for some newer systems, an ultrasonic sensor.
For an anemometer, wind speed is measured as a function of the rotating assembly, while direction is based on relative position of the vane.
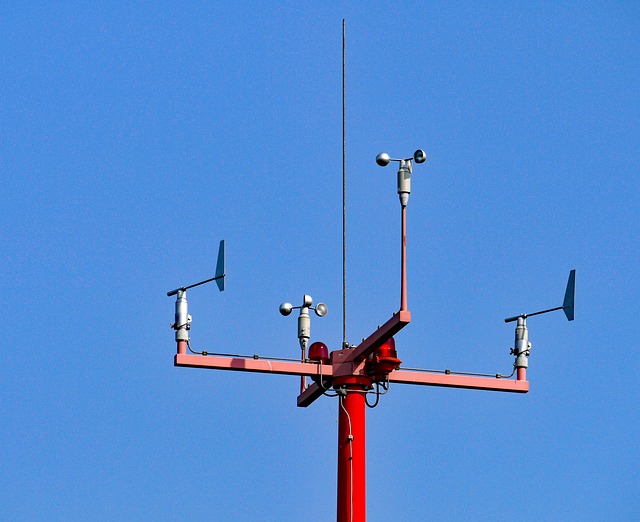
Ultrasonic systems used in newer installations utilize high frequency sound pulses to measure the difference in transmission time between the emitter and the receiver.
Wind direction effects the time required to emit and receive each pulse, and both wind speed and direction can be determined. The advantage of these newer systems is the substantial reduction in required maintenance and more precise sensing.
NOAA ASOS stations now use the ultrasonic sensor, while many AWOS systems continue to use the anemometer and vane system.
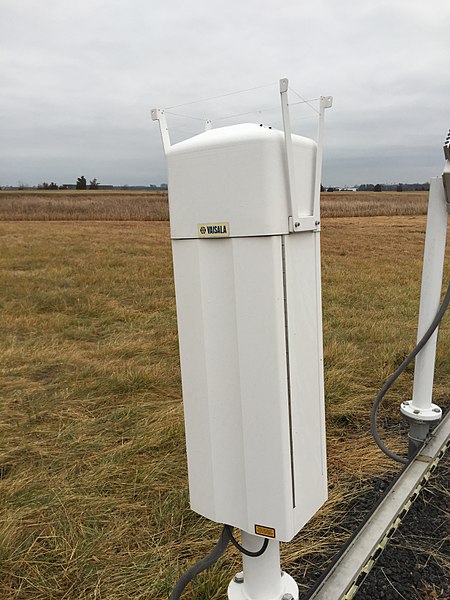
Visibility
Visibility is measured using two primary sensor types: Forward Scatter Sensors and Transmissometers.
Forward Scatter Sensors direct an offset infrared beam toward a sensor that detects the infrared light deflected into the sensor by atmospheric particulates. The ratio of this deflection is used to calculate the visibility.
Transmissometers use a similar technique but observes the reduction in brightness of the transmitted beam over a fixed, known distance. Transmissometers are the preferred sensor where highly accurate low visibility measurements are required, but their increased cost results in their use largely at larger airports.
Temperature and Dewpoint
Temperature and Dewpoint are measured by independent sensors, the thermometer and hygrometer. These are sometimes combined into a single unit called a hygrothermometer.
Thermometers
The thermometer is a standardized, precise device called a resistive temperature device, or RTD. RTDs are used widely to measure temperatures and are found in airplanes for determining outside air temperature, exhaust temperatures and cylinder temperatures amount other applications.
RTDs operate based on changes in voltage resulting from the change in resistance of the selected metal with temperature. The device is essentially a temperature sensitive voltmeter.
Hygrometers
Hygrometers measure dewpoint by shining infrared light on a mirror which directs light to diodes that measure the amount of reflected light. The mirror is cooled until dew forms on the mirror and the reflected light is reduced.
The mirror is temperature controlled to determine when the condensation forms and thus, the dewpoint. Electronic control circuits increase or decrease the mirror temperature based on output from the diodes to determine the dewpoint.
ASOS systems have transitioned to capacitance sensors which electronically calculate dewpoint based on relative humidity and the temperature of the capacitive element. Capacitive hygrometers sensors use the change in conductivity of a material between two electrodes to determine the change in humidity.
Altimeter Setting or Barometric Pressure
Barometric pressure is determined from static pressure sensors that work in much the same way as an aircraft’s altimeter.
A strain gauge outputs a voltage and as the pressure increases and decreases, that voltage output varies as well. This voltage is then correlated to calibrated, known voltages at various pressures to determine the current atmospheric pressure.
Systems installed in AWOS and ASOS stations, use double or triple redundant barometers.
Density Altitude
Based on the measurement of barometric pressure and temperature, density altitude is a calculated value. Density altitude is calculated according to the following:
Density Altitude = Pressure Altitude (ft) + (120 * (OAT – ISA Temperature)
Cloud Height and Coverage
Cloud bases are measured using Ceilometers. Ceilometers us an infrared or ultraviolet laser pulse to determine cloud height based on signal return time. There are variations in the mechanical system that these devices use to function, but the same basic principle applies.
These devices require high precision given the relative distances measured and the speed of light. To determine the cloud coverage, signal returns are time averaged to determine sky obscuration. These systems are calibrated to allow readings up to 25,000 feet.
Because these systems use laser pulses, they can be prone to failure due to moisture or airborne particulates.
Precipitation Type and Accumulation
The type of precipitation is determined using a “Present Weather Sensor” which uses an infrared LED to detect scintillation patterns from falling particulates. These systems are only able to detect rain or snow. Other forms of precipitation are not detected by this sensor.
Accumulation sensors are essentially fancy, calibrated buckets.
Technically called a “tipping bucket rain gauge” the system accumulates one one hundredth (0.01) of an inch of precipitation in a carefully balanced bucket. That bucket tips when sufficient weight is present, and a computer counts the number of buckets that are filled over time.
This is subject to failure in freezing precipitation, so NOAA has developed an “All Weather Precipitation Accumulation Gauge” for use in ASOS systems. This sensor functions as a continuously operating scale and is less prone to failures. Few of these systems have yet been installed.
Lightning Detection
In the United States, a national network of sensors is used to triangulate lightning strikes. However, for sites located away from the sensor network, or that require more precision, or independence from that network, standalone sensors are used.
The independent sensors sense ambient light changes due to the bolt and electrical field changes. Depending on the distance of the detected strike, the weather report codes for the distance of the storm. These are the primary sensors used in AWOS and ASOS systems.
Commercial providers of these sensors offer an array of other potential sensors to detect runway conditions, freezing rain, windshear alerting, and other relevant data.
The same sensors are used to generate ATIS reports. It is often the case that even at airports with ATIS reporting, there is a parallel AWOS or ASOS system that outputs data to a phone line or is published for consumption by online systems.
Using ATIS, AWOS, and ASOS for Flight Planning and Execution
Flight planning is dependent on weather planning, and it is valuable to understand the source and pitfalls of the observed weather along the route of flight, as well as how to identify the source of weather information.
Commonly, pilots often use online or mobile app-based weather and flight planning tools to prepare for a given flight. These sources derive their information from FAA publications, perhaps most importantly, the Chart Supplement publication as discussed previously.
To use Wichita Dwight D. Eisenhower National Airport (KICT) as an example, review the following:
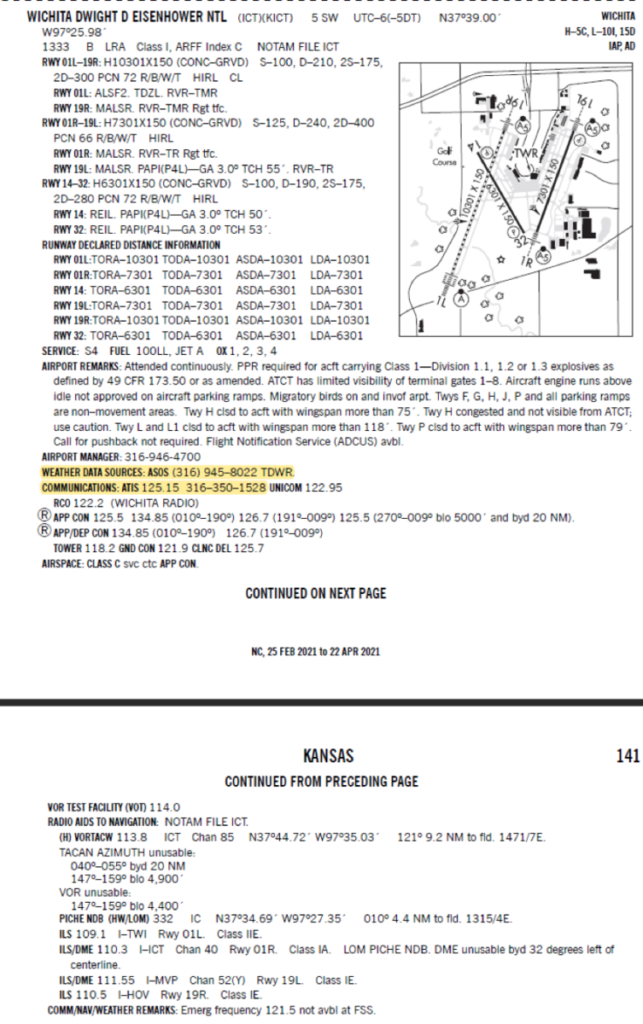
The Wichita airport has two sources of weather data, an ATIS and an ASOS. So, which should be used for flight planning?
Remember the ATIS data is the “controlling” reported and official data that will determine if the airport is IFR, VFR, cloud ceiling and so on for arriving and departing.
The ASOS then functions as a “minute” weather source that is reflective of the conditions at the time of listening to the phone recording.
So, the ASOS becomes a useful tool when weather is changing quickly or if the ATIS is relatively old.
An additional note is included with the ASOS description; TDWR – meaning there is Terminal Doppler Weather Radar associated with the ASOS station, indicating that windshear detection is available on the ASOS recording and by extension to the controllers during periods of thunderstorm activity.
But the communications and weather section are not the only helpful piece of information associated with the Chart Supplement pages.
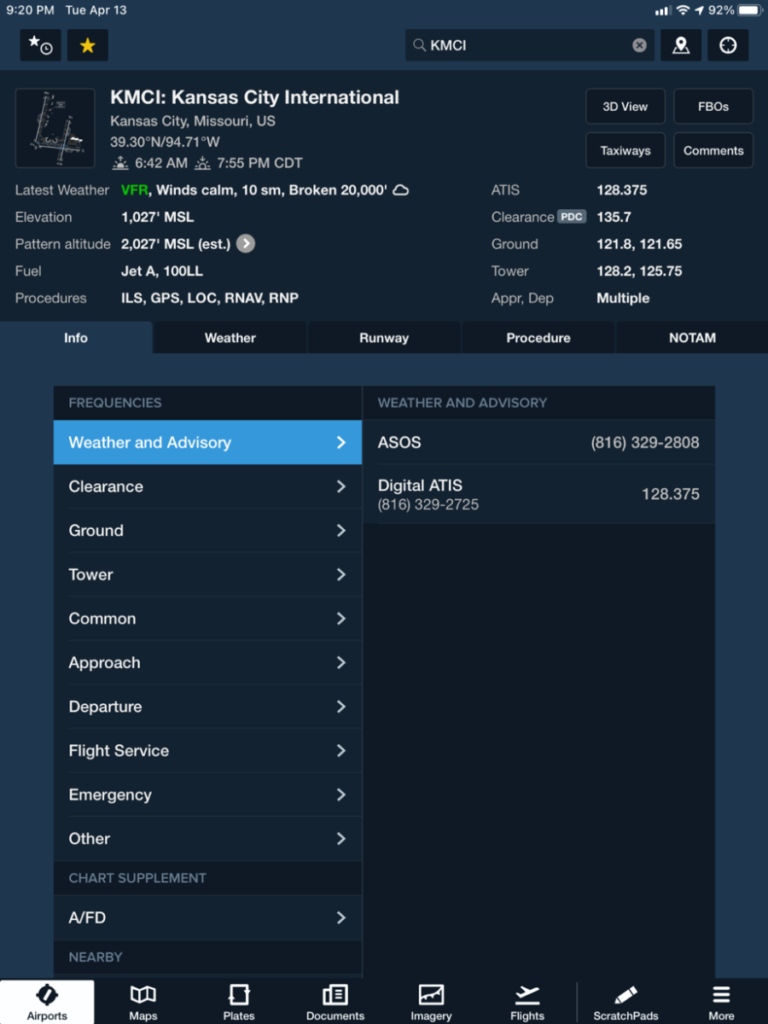
Consider Kansas City International’s (KMCI) page:
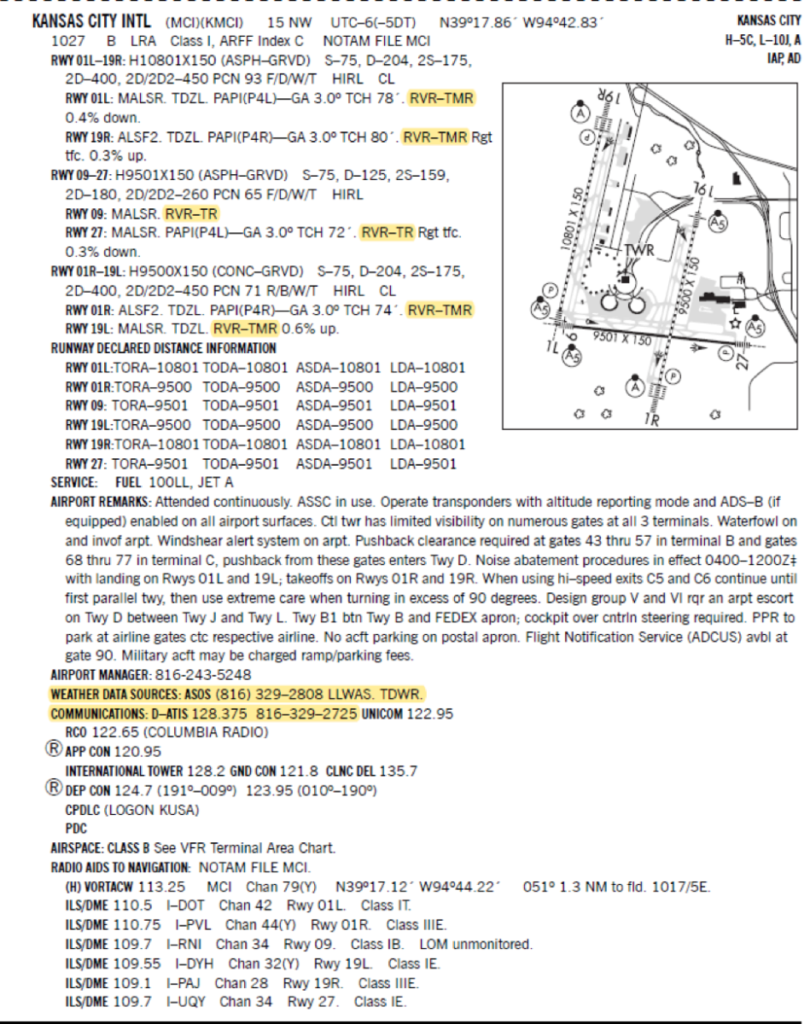
KMCI, being a class B airport, is expected to provide airline crews with extremely accurate weather conditions on the field during low visibility conditions. Looking at each of the runways, the specific RVR (Runway Visual Range) reporting is provided, with T / M / R indicating Touchdown, Midpoint and Rollout portions of the runway.
So, it is possible to know that RVR reporting can be specified for each portion of the runway, which plays a role in Part 121 and Part 135 operating requirements.
Also, it’s worth noting that KMCI operates a D-ATIS or Digital ATIS system, which digitizes the ATIS recording for consumption by appropriately equipped aircraft FMS systems.
Knowing where to look on the official publication is helpful but given the reliance of many pilots on Foreflight or its equivalents, identifying the type of weather source can be more difficult.
Remember first that METAR data is generally recorded at one-hour intervals unless modified by human intervention, in which case a SPECI report is filed. So, when looking at Foreflight or its equivalents, be mindful of the reported time stamp for the data.
Foreflight makes this easy with an age label in the METAR window.
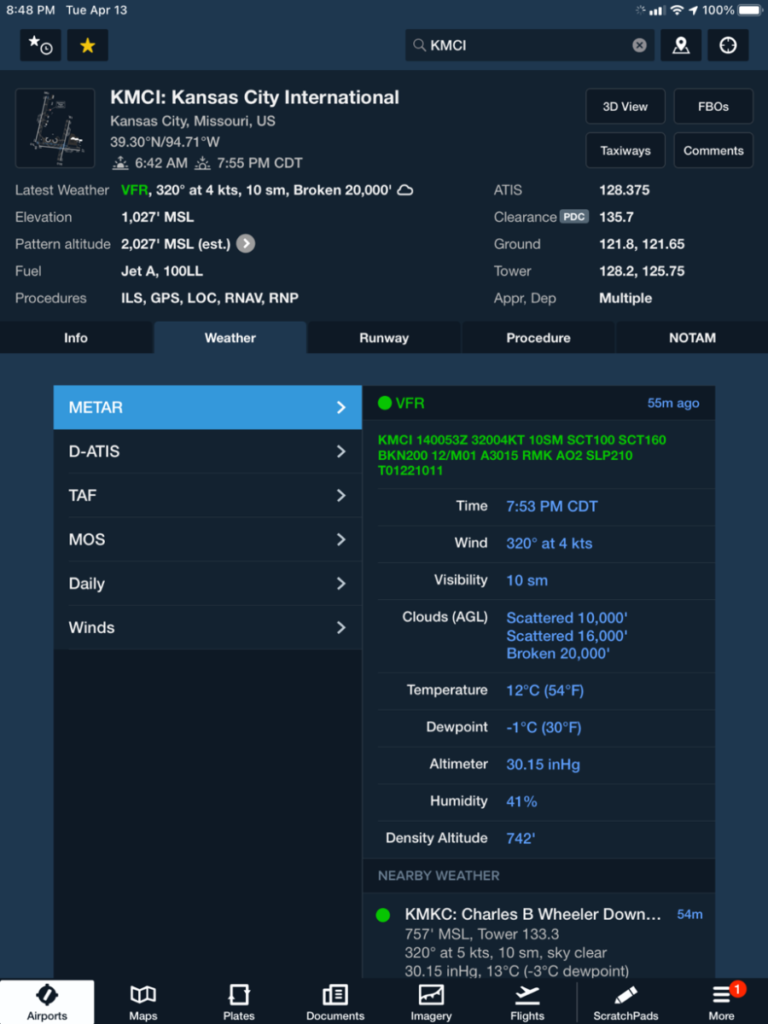
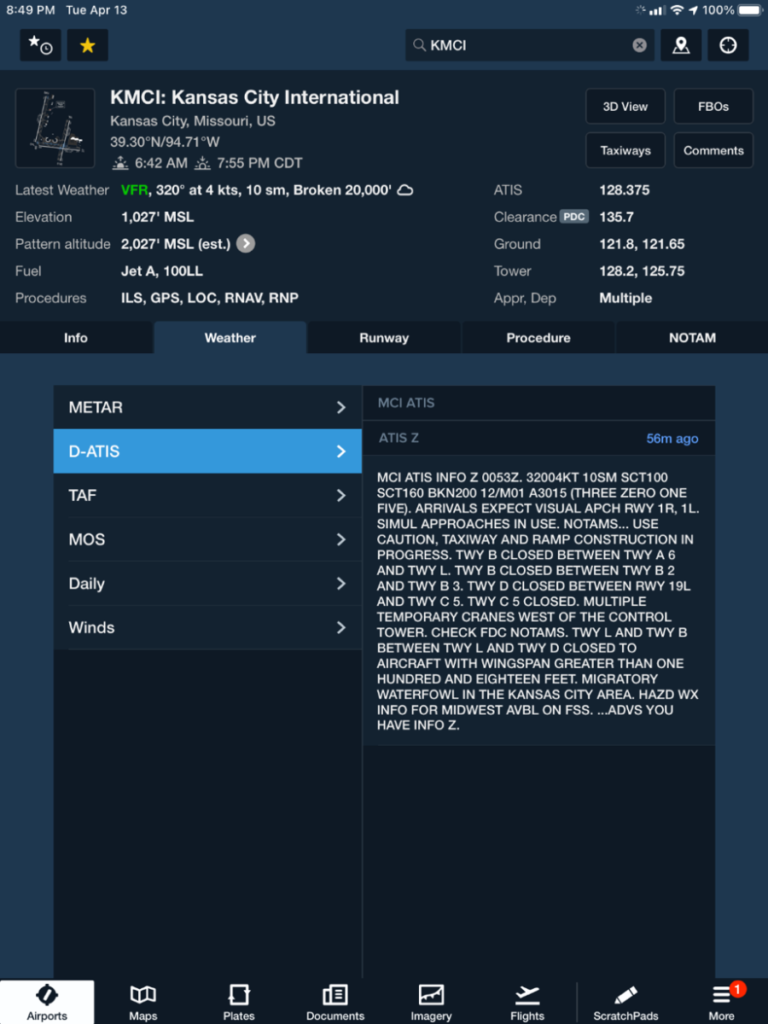
The weather source is also broken out in Foreflight based on source. KMCI includes a tab for the METAR and for the D-ATIS, while the header includes a label for the weather.
Accessing the METAR data is often sufficient for much of the preflight planning process, but if it is necessary to access up the minute weather for a departure or arrival airport via a mobile application, the appropriate automated weather station is required.
Looking at the Foreflight data for KMCI above, the weather source is indicated as an ATIS station, which will only broadcast the most current ATIS data which may be up to an hour old.
But ATIS data is often generated initially by an automated system then translated by the human operator. Looking under the frequencies tab for KMCI reveals a “hidden” ASOS station.
Calling the associated phone number provides up to the minute weather recordings, which can be supremely useful in rapidly changing frontal weather conditions. If the automated station had a frequency, it would be provided in this location as well.
Remember that though Foreflight was the example application in this case, different apps will provide different means of identifying the type of weather report provided, it is good practice to get to know where to look to identify the source of weather as part of normal preflight planning actions for the specific app or data source in use.
The preflight process may also include a simple scan of navigation charts. Fortunately, the type of weather source is identified on both sectional charts and enroute IFR charts.
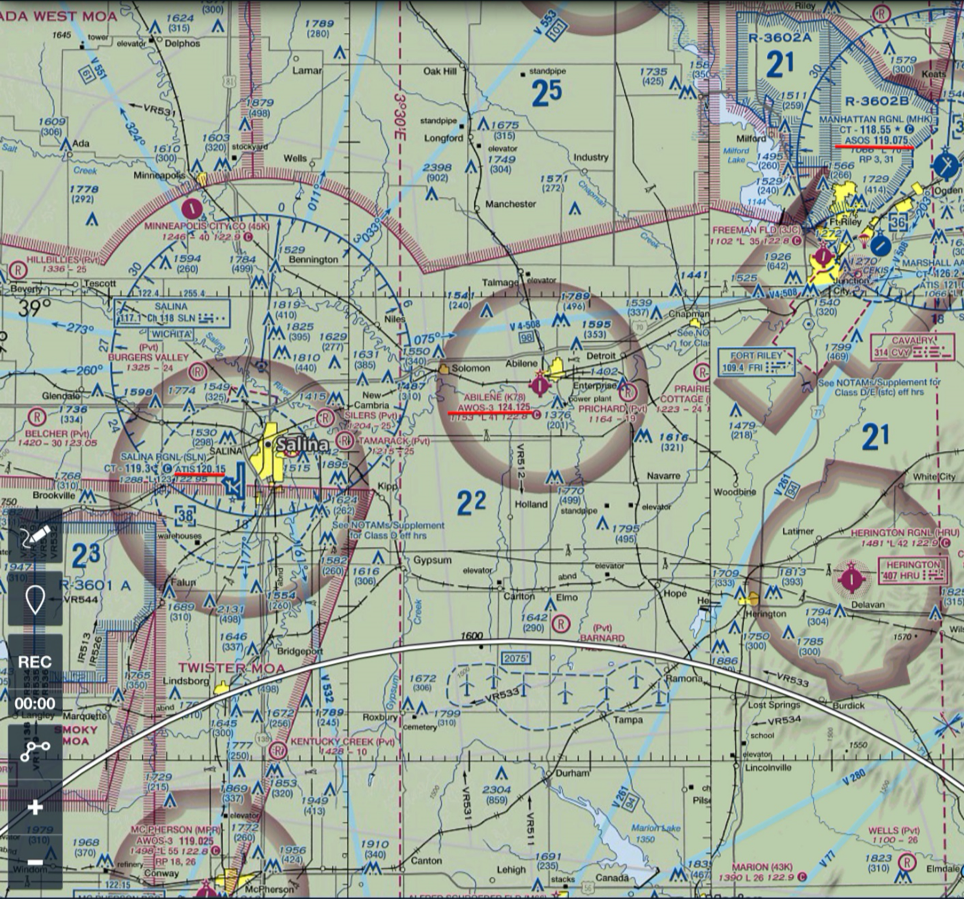
The availability of weather stations along a route of flight during VFR operations may seem trivial during early student solos where the weather is consistently good, but on long cross-country flights to unfamiliar areas in changing or marginal conditions, quick identification of routes between weather stations can pose significantly better situational awareness.
Similarly, knowing what type of station is available offers clues, in light of the service table above, as to what weather phenomena can be monitored.
Particularly during IFR operations, the ability to identify the type of weather available at an airport can be crucial during diversion scenarios.
Diversion to an airport with weather data usually guarantees lower weather minima and where applicable, the availability of monitored weather data is even more helpful.
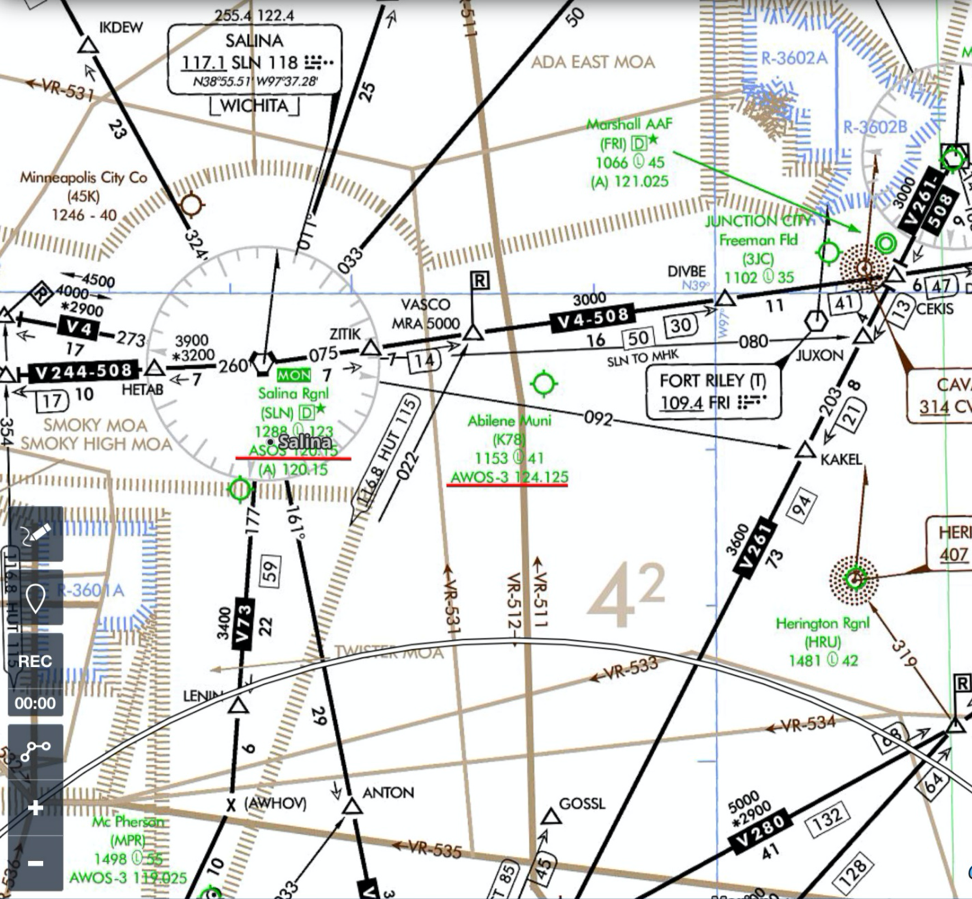
In the chart above, while Herington Regional (HRU) is an IFR airport, the lack of weather information there would certainly make a diversion to Abilene Municipal or Salina Regional a more tempting prospect.
Notice however, that for Salina Regional, two weather frequencies are provided, the ASOS as well as the (A) 120.15; the second frequency is an ATIS station. Differentiating between these sources has important implications for approach planning and for commercial operations. Those concepts are beyond the scope of this discussion, but awareness of the resource is helpful.
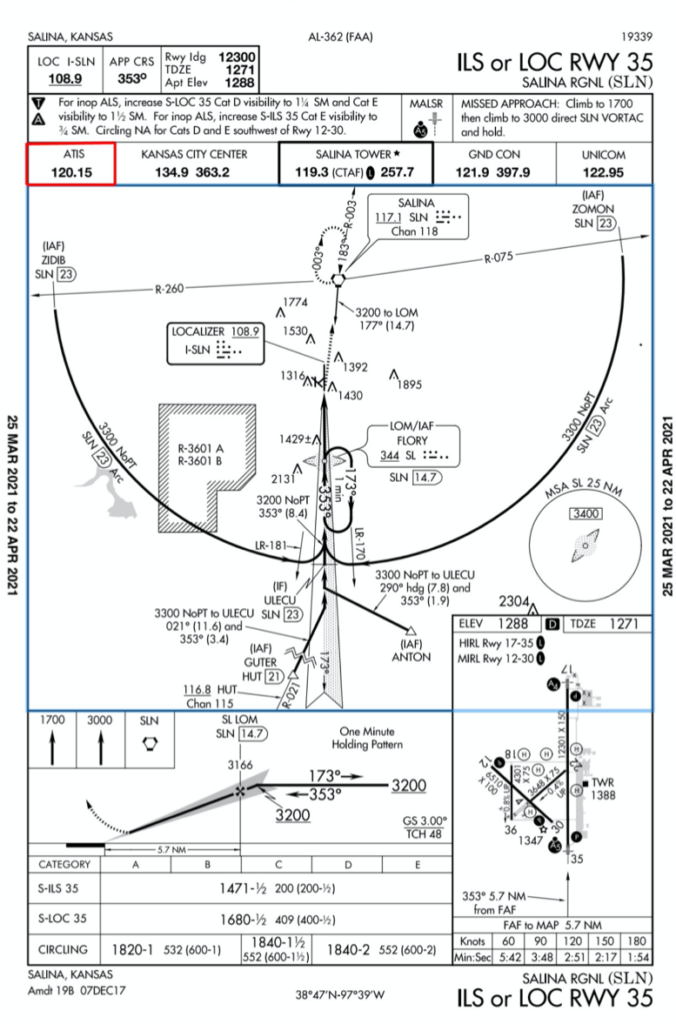
For approach planning and briefing, the approach plate takes precedence in most cases.
Conclusion
Weather data and weather stations are largely automated at most small airports, while larger airports will tend to use monitored systems that rely on human intervention.
Depending on the installed sensors, various weather phenomena will be detectable. But winds, temperature, dewpoint, visibility, the altimeter setting, and cloud conditions will universally be available at airports with weather stations and many stations will offer addition information.
At non-airport automated stations, the available data may be greatly reduced, but that data is largely outside the scope of aviation planning resources. To make the best use of what these systems offer to pilots, become familiar with the tools available as mobile applications or as paper charts, and know where to find the pertinent weather source types and frequencies.


